SaaS cohort analysis: retention and a worked example
Build a SaaS cohort analysis with a worked retention table. Separate customer and revenue retention, and compare groups at the same age.
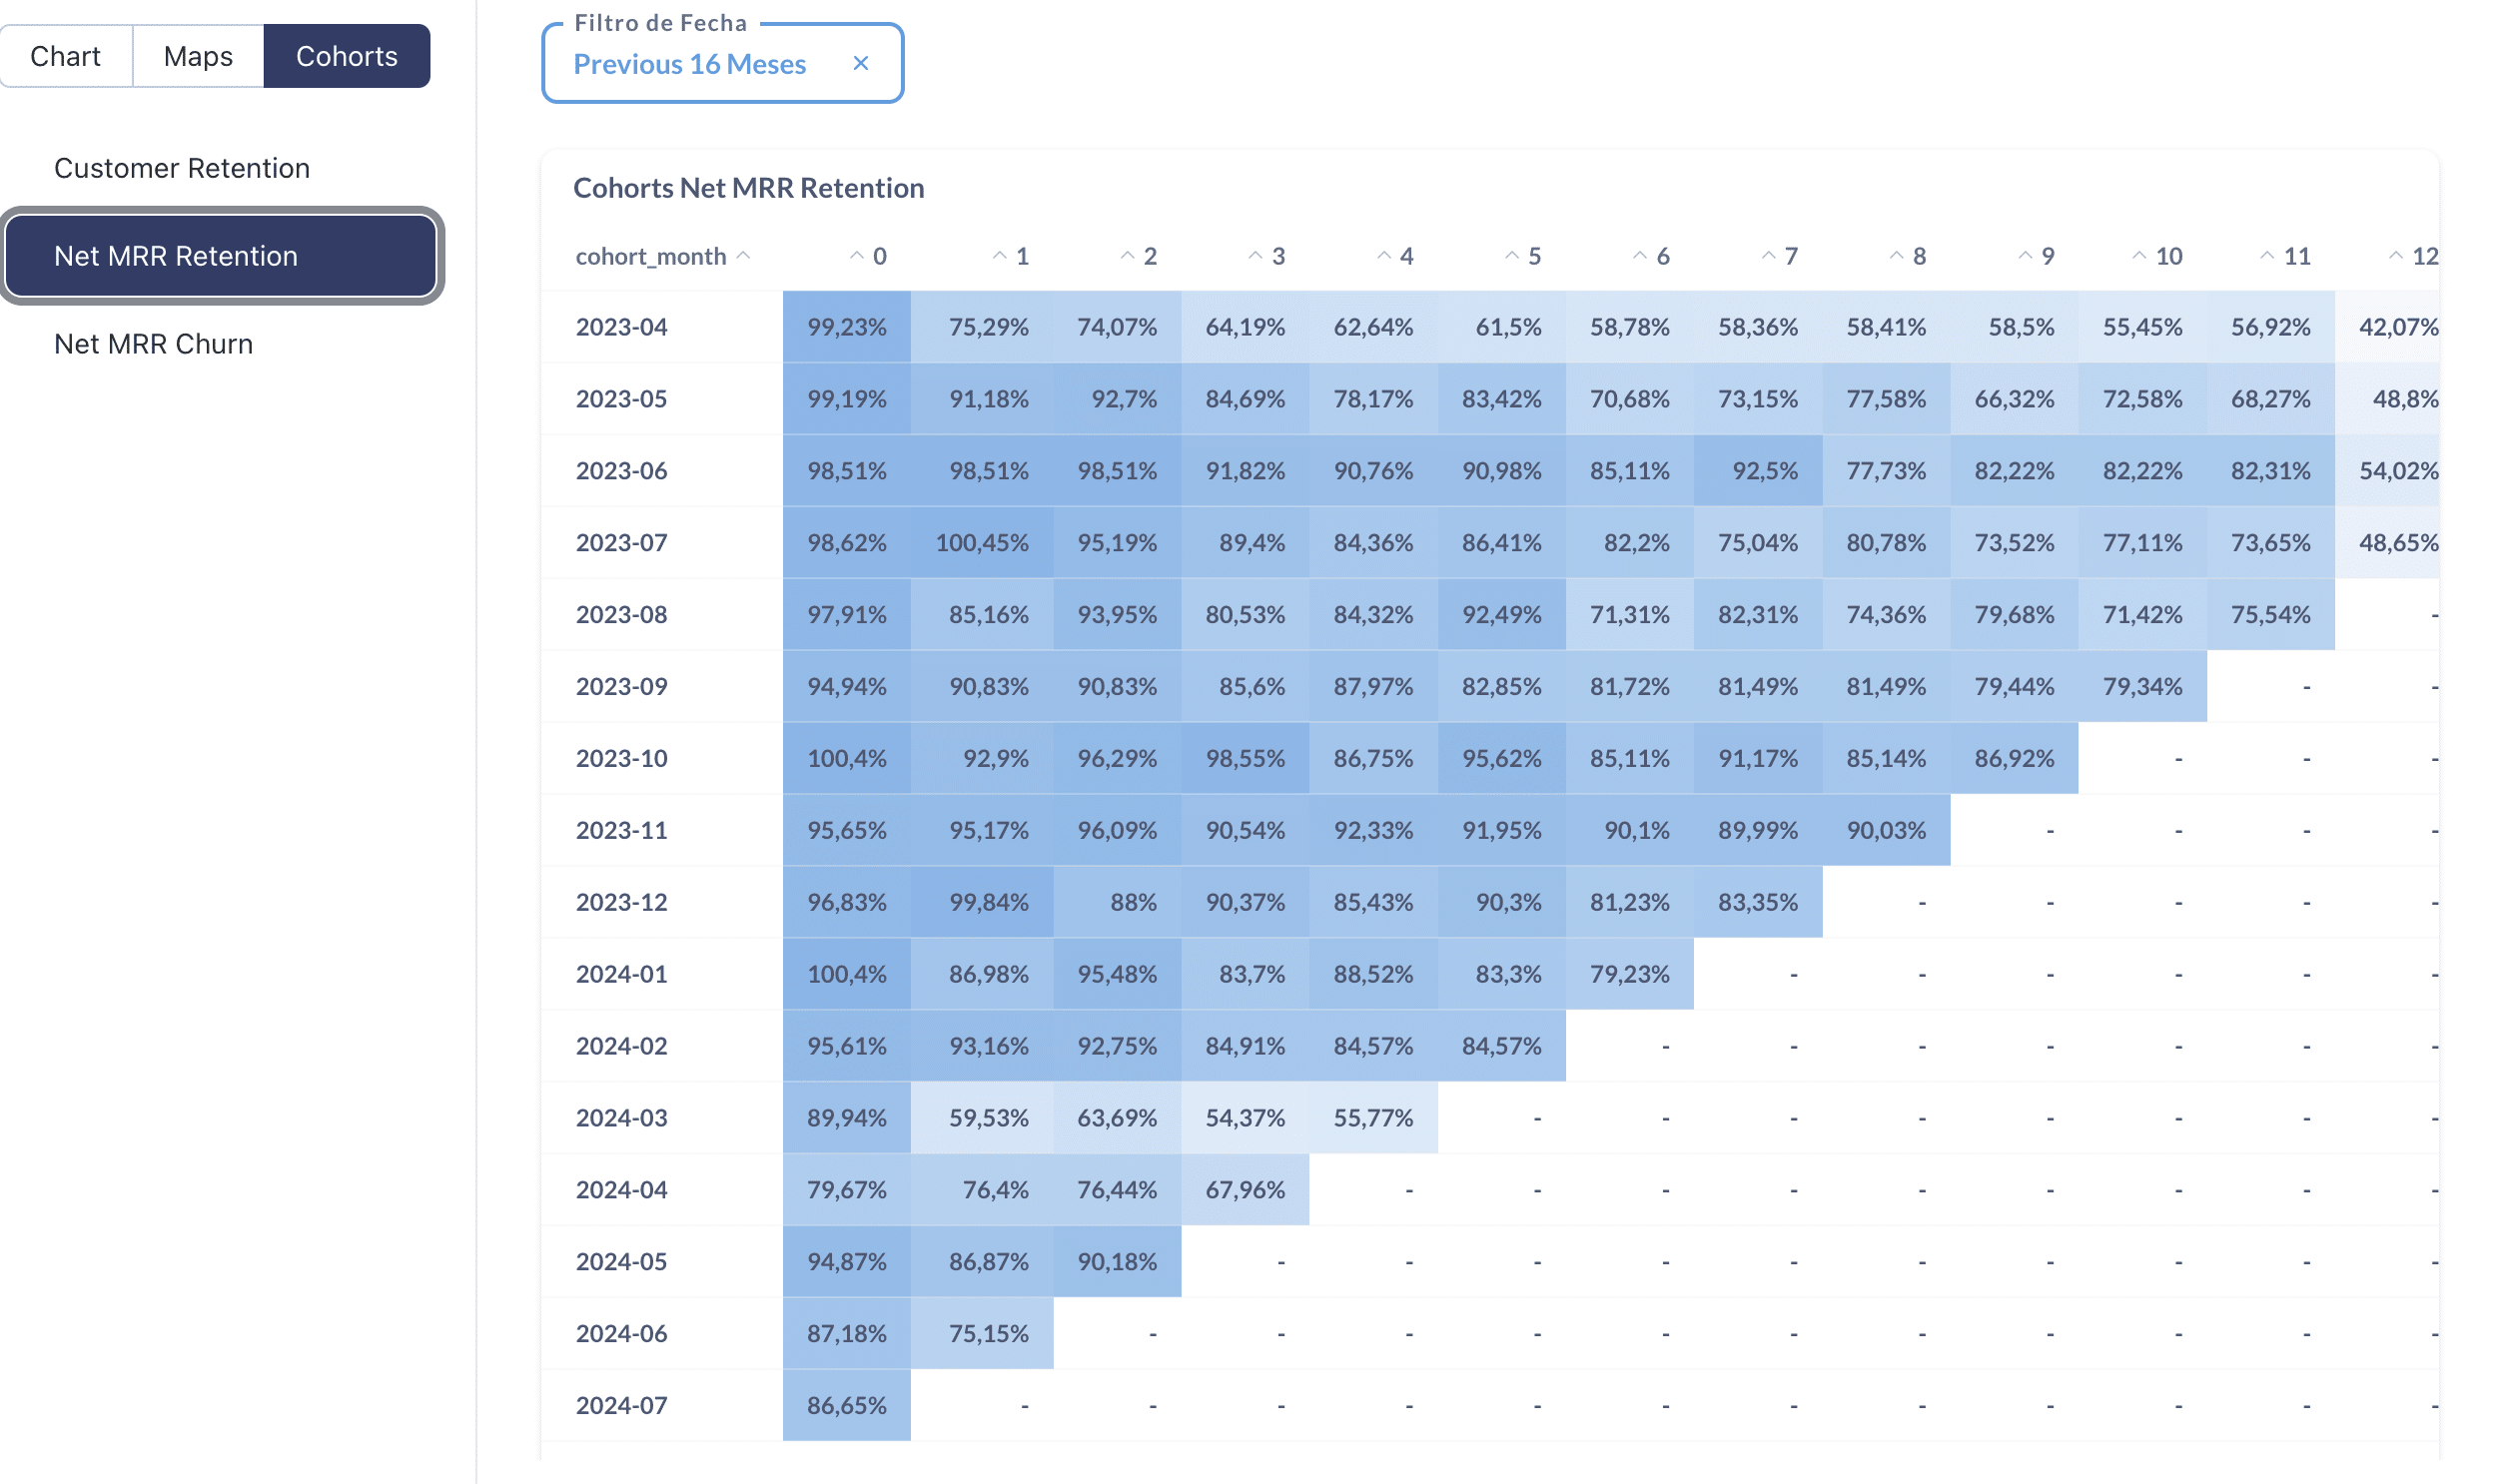
Cohort analysis groups customers by a shared starting event, such as their first paid subscription, and follows them at the same age. It reveals retention changes that can be hidden by growth in the total customer base.
Define the starting event and activity
Choose first purchase, registration or first paid subscription; do not mix them in one cohort definition. Specify what counts as active and how reactivations, trials and cancellations are treated. This example starts a cohort in its first paid month.
A customer retention table
These are illustrative figures. Each row keeps its original customer count as the denominator.
| Cohort | Starting customers | Month 0 | Month 1 | Month 2 |
|---|---|---|---|---|
| January | 100 | 100% | 80% | 70% |
| February | 120 | 100% | 85% | 75% |
| March | 150 | 100% | 88% | — |
February retains 102 customers in month 1 and 90 in month 2. March has not reached month 2: the dash is not zero. Comparing February at month 2 with March at month 1 would mix different customer ages.
Customer retention = active customers from the cohort in the period / initial cohort customers × 100. Do not include customers acquired later in an earlier cohort’s numerator.
Revenue retention tells a different story
Suppose January started with €10,000 in MRR. If the same cohort later contributes €10,500, net revenue retention is 105%, even if customer count fell. Expansion can offset lost accounts. Customer retention cannot exceed 100% when the cohort is fixed and customers are counted uniquely.
Stripe documents both views, assigning cohorts when subscribers first generate positive MRR and reflecting expansion in revenue retention. Document differences if your own analysis uses another starting event.
Turn the table into an investigation
Compare acquisition periods, plans or channels when the groups contain enough observations to be useful. Investigate onboarding changes, pricing and acquisition quality. A cohort table shows a pattern; it does not establish which change caused it.
Read retention alongside ARPU to distinguish customer longevity from revenue per customer. A SaaS metrics view and recurring report can carry those definitions into the team’s review.