The B2B SaaS Metrics Journey Framework
A practical framework for SaaS metrics across the customer journey: acquisition, activation, retention, monetisation, unit economics — formulas and benchmarks.
There are plenty of models that try to explain the customer life cycle, but very few that fit a SaaS business end-to-end — covering its quirks, its multi-stage funnel and its post-sale dynamics in one consistent picture.
After working with 100+ SaaS platforms and iterating the model with their teams, this is the framework I now use to map the metrics that matter at every stage of a B2B SaaS customer’s life: The B2B SaaS Metrics Journey Framework.
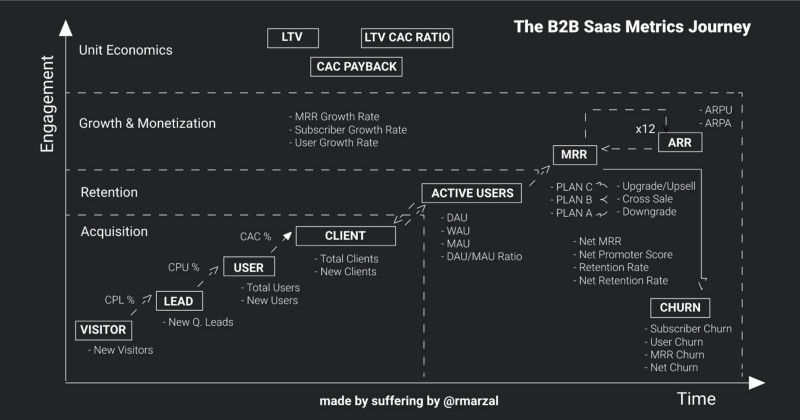
How to read the framework
The framework lives on two axes:
- Horizontal axis: time. Left is “the prospect just landed on your site”; right is “long-term loyal customer”.
- Vertical axis: engagement. The higher up a metric sits, the deeper the engagement with your product or business.
Unit economics live outside this 2-D plot — they’re aggregate metrics that summarise the journey rather than represent any one stage of it.
The framework adapts cleanly to product variants: freemium tiers, free trials, demos, sales-led vs PLG. The stages stay; only the gates between them shift.
I split the customer journey into three blocks:
- SaaS Growth — acquisition + activation
- Retention & Monetisation
- Unit Economics
Let’s walk through each one.
1. Growth metrics — acquisition and activation
You don’t have a SaaS until you have customers paying for the value you deliver. The metrics in this block tell you whether your acquisition engine works.
Reading from the bottom-left (early-funnel, low engagement) up:
Unique visitors
Humans who hit your site without doing anything qualifying.
- KPI: New unique web visitors
- Source: Google Analytics, Plausible, Fathom.
This is a leading indicator, not a revenue predictor. Don’t optimise for it.
Qualified leads
Humans who left their data because they showed interest in your content or your SaaS.
- KPI: New leads, segmented as MQL → SQL → Opportunity
- Source: HubSpot, Salesforce, Pipedrive, Mailchimp.
In B2B SaaS the segmentation matters more than the absolute number. A lead that fits your ICP, has budget and authority, is worth 20 random newsletter signups.
Signups
Users who register on your service for the first time. The first concrete signal that the funnel is working.
- KPI: New signups
- Source: your DB, Stripe, the auth provider.
Customers
Signups that converted to a paying plan.
- KPI: New customers, lost customers, net new customers
Net new customers = New customers − Lost customers + Reactivated customersNet new customers is the cleanest measure of how fast you’re actually growing. It’s the metric I plot on the wall.
CAC (Customer Acquisition Cost)
How much it costs you to land a new customer.
CAC = (Marketing spend + Sales spend) / New customersIn early stages, exclude headcount cost so the metric isn’t distorted by overhead. As you scale, switch to blended CAC (everything in) and a paid CAC (channel ads only) to see the marginal cost of growth.
Tip: also compute cost per lead and cost per signup so you can see exactly where the acquisition funnel is leaking money.
Sales cycle length
Days from first qualified contact to signed contract. In B2B SaaS this varies enormously:
- SMB (<$500/mo): 14–30 days
- Mid-market: 30–90 days
- Enterprise: 90–180 days
A growing sales cycle on a flat ticket size is a smell — usually an ICP that’s drifting wider than the messaging supports.
2. Retention and monetisation
This is where SaaS economics actually live. Acquiring a customer doesn’t pay back your CAC; keeping them and expanding them does.
Active users (DAU / WAU / MAU)
Three time windows for “users that did the action that defines value”:
- DAU — daily active users
- WAU — weekly active users
- MAU — monthly active users
The trick is defining “active” properly. It’s not “logged in” — it’s “completed the action that correlates with retention” (created a report, invited a teammate, ran a workflow).
DAU / MAU ratio (stickiness)
Stickiness = DAU / MAUTells you how often the typical monthly user shows up. A 40% ratio in B2B SaaS productivity tools is solid (the typical user comes back ~8+ days a month). For daily-use tools (chat, dashboards) target >50%; for occasional tools (monthly reporting) 15–20% can be correct.
“If there is one number every founder should always know, it’s the company’s growth rate. That’s the measure of a startup. The best thing to measure growth is revenue. The next best, for startups that aren’t charging yet, is active users.”
— Paul Graham, Y Combinator
NPS (Net Promoter Score)
A single-question loyalty score: “How likely are you to recommend X to a colleague?” 0–10. Detractors (0–6), Passives (7–8), Promoters (9–10).
NPS = % Promoters − % DetractorsUseful as a directional signal — a sudden NPS drop usually predicts churn 30–60 days later. Don’t optimise for it as the headline metric; optimise for retention and use NPS as an input.
MRR (Monthly Recurring Revenue)
The recurring monthly revenue from your active subscribers.
MRR moves through six channels each month:
- New MRR — first-time paying customers
- Expansion MRR — upgrades + cross-sell + extra seats
- Reactivation MRR — churned customers who came back
- Contraction MRR — downgrades
- Churn MRR — customers who left
- Retained MRR — kept-as-is
Net New MRR = New + Expansion + Reactivation − Contraction − ChurnARR (Annual Recurring Revenue)
ARR = MRR × 12When MRR is bumpy (early-stage SaaS often is), investors prefer ARR — it smooths the noise. The Series-A benchmark used to be $1M ARR; today VCs are stretching earlier (ARR of $300–500k can be enough if unit economics are clean).
ARPA (Average Revenue Per Account)
ARPA = MRR / Active accountsIn B2B prefer ARPA over ARPU: you sell to companies, not seats. A 50-seat account at $20/seat has an ARPA of $1,000/mo, not $20.
Churn rate
The rate at which you lose customers (or revenue) per period.
Customer Churn (monthly) = Customers lost in month / Active customers at start × 100Benchmarks:
- SMB SaaS: <5% monthly is healthy
- Mid-market: <2% monthly
- Enterprise: <1% monthly
A 5% monthly churn compounds to ~46% lost in a year. Above that you can’t outgrow it.
Gross vs Net Revenue Churn
Gross Revenue Churn = Churn MRR / MRR at start × 100
Net Revenue Churn = (Churn MRR − Expansion MRR) / MRR at start × 100
Negative net revenue churn is the holy grail: expansion within existing accounts more than compensates churn losses. Snowflake and Datadog famously sit at NRR around 130–150%.
Net Revenue Retention (NRR)
NRR = (Starting MRR + Expansion − Contraction − Churn) / Starting MRR × 100| NRR | Meaning |
|---|---|
| < 90% | Bleeding — won’t get to the next round |
| 90–100% | Stable, not scalable |
| 100–110% | Healthy — you scale via acquisition |
| 110–125% | Strong — expansion does most of the heavy lifting |
| > 125% | World-class — investors call you |
Revenue growth rate
MRR Growth Rate = (Net MRR Month B − Net MRR Month A) / Net MRR Month A × 100The single number VCs anchor on for early-stage SaaS. Triple-triple-double-double-double (3x then 2x year-over-year) is the textbook benchmark for top quartile.
Customer Retention Rate
Customer Retention = Renewing customers / Customers due to renew × 100The mirror of churn for accounts. Easy to compute, harder to define cleanly across plan changes — be explicit about whether downgrades count as “retained” or not.
Gross margin
The profit each transaction leaves you, after the direct cost of serving it.
In SaaS, COGS typically include hosting (AWS/GCP), data services, payment-gateway fees, customer support and any human touch built into onboarding.
Mature SaaS gross margins should be ≥75%. Persistently low gross margins usually mean you’re doing services-attached-to-software, not pure software.
3. Unit economics and efficiency
The aggregate metrics that summarise the journey:
Lifetime Value (LTV)
The total value an average customer leaves over their lifetime with your product.
LTV = ARPA × Gross Margin / Churn RateIf ARPA is $500/mo, gross margin 80%, churn 2%/mo:
LTV = $500 × 0.8 / 0.02 = $20,000CAC Payback
Months to recover the cost of acquiring a customer.
CAC Payback = CAC / (ARPA × Gross Margin)Benchmarks: <12 months for SMB, <18 for mid-market, <24 for enterprise. Past that, the business burns cash faster than it earns.
LTV / CAC ratio
LTV / CACThe single most-quoted unit-economics ratio in SaaS. ≥3x is the rule of thumb VCs apply. <3x → inefficient; 3–5x → healthy; >5x → you may be under-investing in growth and leaving market share on the table.
Beyond unit economics: efficiency and cash
For sustainable growth you also want eyes on:
- Magic Number — sales-and-marketing efficiency:
(ΔARR × 4) / S&M spend(target >0.7) - Burn Multiple —
Net burn / Net new ARR(target <2x; <1x is excellent) - Rule of 40 —
Growth rate (%) + EBITDA margin (%)(target ≥40) - Cashflow and runway — the gating metric for whether the rest matters
These will come in their own deep-dive posts.
Wrapping up
The B2B SaaS Metrics Journey Framework is a tool to focus the right metrics for the stage you’re in — not a checklist to instrument from day one. Early-stage: nail the growth metrics. Once you have customers: nail retention and monetisation. Once both are working: lean into expansion and unit economics, and let the operating leverage compound.
If you found the framework useful, share it with the founder or operator who needs it.
Knowing the metrics is the easy part — calculating them with clean data, every day, is what separates the teams that decide on numbers from the teams that decide on gut. That’s exactly what NextScenario automates: connect Stripe, your bank and your accounting tool, and every metric on this page comes alive in real time.
Book a 30-minute demo — we show you your own MRR, NRR, CAC and runway in the meeting, with your real data.